
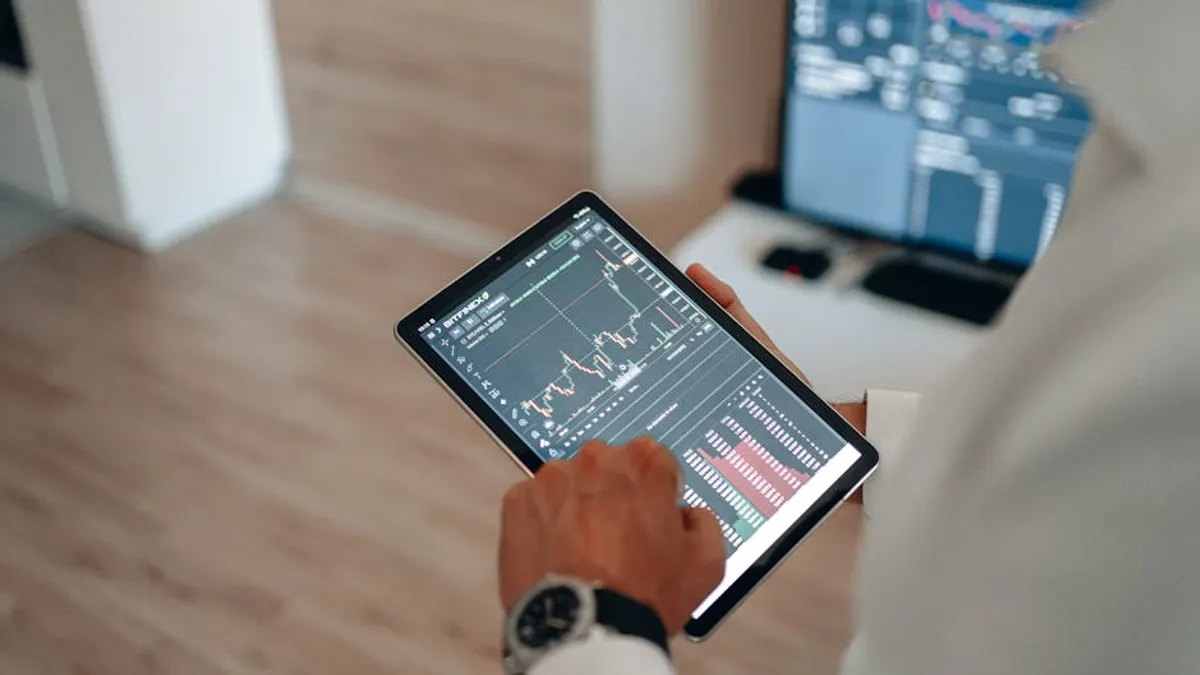
Monitoring the energy market requires a dashboard built not just for data display, but for strategic insight. Raw figures on oil production or gas prices offer limited utility in isolation; their value emerges when integrated into a cohesive view that highlights trends, flags anomalies, and informs critical decisions. For investors, commodity traders, industrial consumers, and policymakers, a well-designed energy market dashboard translates complex, often volatile, data into actionable intelligence for risk management, procurement strategies, and long-term planning.
Core Supply-Side Metrics
Understanding the supply landscape is foundational. These metrics illuminate the availability of energy resources, directly influencing market balance and price stability.
Production Volumes
Tracking the output of crude oil, natural gas, coal, and renewable energy sources provides direct insight into the market's capacity to meet demand. For crude oil, this includes OPEC+ production quotas and actual output, alongside non-OPEC contributions, particularly from shale plays. Natural gas metrics involve dry gas production and associated gas from oil wells. For renewables, monitor capacity additions and generation statistics for solar, wind, hydro, and geothermal. Sustained increases in production often signal potential oversupply, while unexpected declines can trigger price spikes.
Inventory Levels
Storage data for crude oil, refined products (gasoline, diesel, jet fuel), and natural gas are critical short-term indicators. High inventory builds, particularly against seasonal norms, suggest weak demand or excess supply, typically exerting downward pressure on prices. Conversely, drawdowns indicate robust demand or constrained supply. Key reports like the EIA's Weekly Petroleum Status Report and natural gas storage reports from the same agency provide essential weekly snapshots.
Capacity Utilization
For refining and power generation, capacity utilization rates indicate operational efficiency and potential for supply adjustments. Low refinery utilization might signal maintenance outages, economic slowdowns impacting fuel demand, or an inability to process available crude. High utilization suggests strong demand for refined products. In power, capacity factors for different generation types (e.g., nuclear, fossil fuels, renewables) highlight their contribution to the grid and potential for bottlenecks.
Import/Export Balances
Net trade flows for energy commodities reveal a country's or region's reliance on external sources or its role as a supplier. Significant shifts in import or export volumes can alter global supply-demand dynamics. For instance, a major importer reducing its intake due to domestic production increases can free up global supply, impacting prices elsewhere.
Essential Demand-Side Indicators
Demand-side metrics provide context for consumption patterns and future energy needs, often driven by broader economic and environmental factors.
Economic Growth & Industrial Output
Energy consumption is closely correlated with economic activity. GDP growth rates, industrial production indices, manufacturing PMIs, and freight activity serve as proxies for industrial and commercial energy demand. A slowdown in these indicators often precedes a reduction in energy consumption.
Weather Patterns & Seasonal Consumption
Temperature anomalies, heating degree days (HDD), and cooling degree days (CDD) significantly impact demand for natural gas (heating) and electricity (cooling). Seasonal variations are predictable, but extreme weather events can cause sharp, short-term demand surges or drops, testing grid resilience and influencing spot prices.
Energy Intensity & Efficiency Trends
Tracking energy intensity (energy consumption per unit of GDP) and adoption rates of energy-efficient technologies provides insight into long-term demand trajectories. A decreasing energy intensity suggests an economy becoming more efficient, potentially dampening future energy demand growth even with economic expansion.
Transportation Activity
Metrics like vehicle miles traveled (VMT), airline passenger miles, and shipping freight volumes directly correlate with demand for gasoline, jet fuel, and bunker fuel. Changes in these indicators reflect shifts in consumer behavior and global trade, impacting petroleum product markets.
Price & Volatility Benchmarks
Direct market prices and their fluctuations are the ultimate reflection of supply and demand, offering immediate commercial relevance.
Spot & Futures Prices
Monitoring benchmark crude oil prices (WTI, Brent), natural gas prices (Henry Hub, TTF), and electricity prices in key hubs is essential. Futures curves indicate market expectations for future prices, with contango (futures price > spot price) suggesting oversupply and backwardation (spot price > futures price) indicating tight supply.
Basis Differentials & Spreads
The difference between prices at different locations (basis differentials) or between related products (crack spreads for refining, spark spreads for power generation) reveals regional supply-demand imbalances, infrastructure constraints, and profitability margins for energy producers and processors.
Volatility Indexes
Indexes like the CBOE Crude Oil Volatility Index (OVX) measure the market's expectation of future price volatility. High volatility indicates increased uncertainty and risk, often leading to wider bid-ask spreads and more cautious trading behavior.
Regulatory & Geopolitical Influences
External factors, often unpredictable, can dramatically reshape energy markets.
Policy Changes & Subsidies
Government policies, including carbon pricing, renewable energy mandates, fossil fuel subsidies, and energy efficiency standards, directly impact investment decisions, production costs, and consumer behavior. Changes can create significant market shifts.
Geopolitical Risk Premiums
Political instability in major producing regions, trade disputes, and international sanctions can introduce risk premiums into energy prices. Monitoring geopolitical events and their potential impact on supply routes or production capacity is crucial for risk assessment.
Environmental Regulations
Regulations on emissions, water usage, and land access can increase operating costs for fossil fuel producers and accelerate the transition towards cleaner energy sources. These regulations influence long-term investment cycles and the competitiveness of different energy types.
Pro Tip: When constructing an energy market dashboard, prioritize data granularity and source reliability. Real-time data is valuable for immediate trading decisions, but lagging indicators, when analyzed over longer periods, often provide clearer insights into fundamental shifts. Beware of mistaking correlation for causation; always seek to understand the underlying drivers of observed trends.
Actionable Insights from Dashboard Monitoring
A well-curated dashboard moves beyond reporting to enable proactive decision-making. By integrating these diverse metrics, businesses can:
- Anticipate Price Swings: Early detection of inventory builds, production cuts, or demand shifts allows for timely adjustments to procurement or sales strategies.
- Optimize Hedging Strategies: Understanding futures curves and volatility helps in structuring more effective hedging programs to mitigate price risk.
- Inform Investment Decisions: Long-term trends in energy intensity, renewable capacity additions, and regulatory shifts guide capital allocation in energy projects.
- Assess Supply Chain Risks: Monitoring geopolitical events and import/export balances helps identify potential disruptions to energy supply chains.
- Benchmark Performance: Comparing internal energy consumption or production against market averages or competitor data provides context for operational efficiency.
The true value of an energy market dashboard lies in its ability to synthesize disparate data points into a coherent narrative, empowering stakeholders to navigate the complex and dynamic energy landscape with greater confidence.
Frequently Asked Questions
How often should energy market dashboard metrics be updated?
The update frequency depends on the metric and its intended use. Price data, inventory levels, and real-time production estimates may require daily or even hourly updates for trading decisions. Economic indicators or long-term policy changes can be monitored weekly or monthly.
Can these metrics predict future energy prices accurately?
While these metrics provide strong indicators and help forecast trends, the energy market is influenced by numerous unpredictable factors (geopolitical events, extreme weather). They offer probabilistic insights and risk assessment, not guaranteed predictions.
What is the difference between leading and lagging indicators in energy markets?
Leading indicators, like futures prices or economic sentiment, attempt to predict future market movements. Lagging indicators, such as historical production volumes or consumption data, confirm trends that have already occurred, providing context for past events.
How can I customize an energy market dashboard for my specific business needs?
Start by identifying your specific exposure and objectives. A utility company will prioritize different metrics (e.g., power generation mix, transmission capacity) than an industrial manufacturer (e.g., natural gas procurement costs, carbon prices). Tailor the dashboard to highlight metrics directly impacting your operational costs, revenue, or risk profile.